Year 4 Update – Wk 9

24th October – Whole school photo 4F & 4W individual and class photos
25th October – 4L individual and class photos
27th October – Year 4 Wetland Park field trip
28th October – Sibling photos
1st November – Year 6 bake sale – bring $5-$10 for a tasty treat! 
4th November – 4F class assembly
16th-18th November – Year 4 Camp

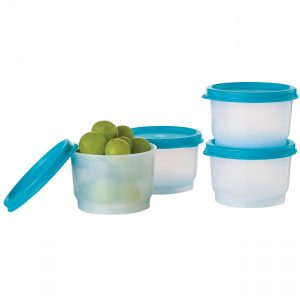 Please support us and your child by helping them create a positive impact on the habitat around them by bringing their snacks in reusable snack boxes and drinks in reusable bottles.

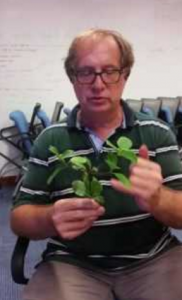 We were fortunate to enjoy a visit from BHS’s favourite environmental expert this week, when Paul Melsom came to work with Year 4. Despite the rain on Wednesday, he managed to spend time with all of the children teaching them about ways they can identify native HK plants. They even learnt some species’ Latin names, too!
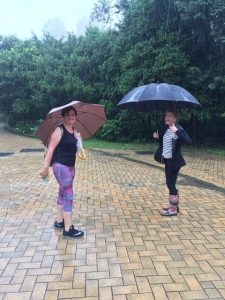 dst of the amber, red and black rainstorm warnings on Wednesday!) to make plans for our excursion next week. We are really looking forward to the excursion as we know it will support the work we are doing during this U.O.I. very well.
 Who We Are
Central Idea: People’s behaviour impacts on the habitats of other living things.
Lines of Inquiry
An inquiry into:
- Different habitats and the living things found in Hong Kong
- Impact of behaviour on habitats
- Human responsibility to habitats
The children have continued inquiring into habitats this week, through their work with Paul Melsom and, also, through their Information Literacy lessons with Ms. Jeves.
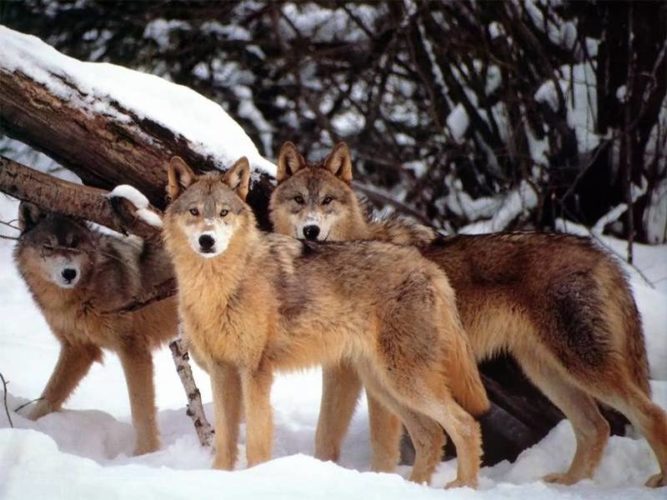
Ms. Jeves is helping the children to develop their observational skills and they watched a video about the impact of the re-introduction of wolves to Yellowstone National Park in USA. The children identified the consequences of this decision and recorded their thoughts on a consequence wheel.
This week, the children will be beginning to focus on Hong Kong habitats and Mr. Thompson will be visiting all classes to share a case study he has completed about forest habitats in Hong Kong. During our excursion, we will be considering the importance of wetland habitats to Hong Kong and how humans have impacted on these areas.

Central Idea – Multiplication and division are related to each other and used to help us solve problems.
Lines of Inquiry:
- The methods that are used to solve calculations
- The operations of multiplication and division
- The different relationships between the four operations
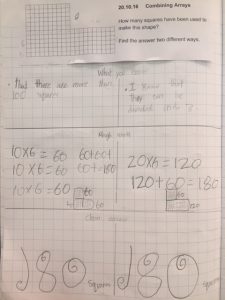
This week we have continued with our open-ended learning engagements around multiplicative thinking. The children are becoming more confident about tackling a challenge by themselves, sharing their strategies and persisting in order to reach a solution. This week, the students have been recapping on what they know about arrays in order to find out how many squares were needed to create a larger shapes (see example of 4F Hena’s work below).
Next week, we will be continuing our inquiries into arrays, whist also revising some useful written and mental strategies for solving multiplication problems.
Strand Maths: Data Handling
Central Idea – Different graph forms highlight different aspects of data more efficiently.
Lines of Inquiry:
- Collect, organize and represent data (including bar and line graphs, 3 ring Venn diagrams and Carroll diagrams) where one object or symbol can represent many data values
- Interpret data and draw conclusions using a variety of scales
- Describe the advantages and disadvantages of data representation forms
This week’s homework will give the students an opportunity to practise some of these skills.

The children have now all had the chance to write a simple fable of their own that they have evaluated. The evaluations have allowed the children to identify the ways in which they could improve their writing when they come to write their next fable. 
The teachers have been continuing to use English lessons to develop the skill of inference as this is our comprehension focus for this unit. We have been making inferences from pictures, animated shorts and writing.
4F watched this lovely animation and were amazed how much they could ifer about the meaning of the story, despite their being no words!


It is well worth watching if you haven’t seen it before (see video below).


*Daily home reading
A reminder that the colour of the home reading book your child brings home will reflect their reading ability at the end of Year 3. However, as reading assessments continue over the course of the coming few weeks, this may or may not change. PLEASE be reminded that the colour sticker on the reading book your child brings home is far less significant than the development of fluency AND comprehension. There is also an expectation that your child will read a book and complete any quizzes on Reading Eggspress twice a week.
*Spelling
The children will have 10 new words to learn each week (Friday) and will be tested on them by a classmate three times per week. The words they have comprise of some vocabulary relevant to our current U.O.I., some words relating to the spelling rule that we are currently learning about and some words of their choic
*Home learning task 21.10.16
Year 4 Home Learning – MATHS – 21.10.16
 To support your understanding of data-handling, this week’s home learning will give you the opportunity to “collect, organise and represent data” about how much you, your family and neighbours/friends are impacting the habitats around you.
Collect Data
- Conduct the survey: Complete this survey for yourself and then survey as many members of your family, etc. as possible. Record their answers using a tally system in the space provided.
Organise Data
- Add these two sets of data together and write the total in the space provided.
Represent Data
- Use the totals given to create a graph or chart showing how “green” your group is!
“KNOW YOUR IMPACT” SURVEY
| How green are you? | Me | Others | Group
Total |
| Have you travelled by car in the last two weeks? | |||
| Have you used public transport in the last two weeks? | |||
| Have you recycled your plastic/paper waste in the last two weeks? | |||
| Have you recycled your aluminium waste in the last two weeks? | |||
| Have you recycled your glass waste in the last two weeks? | |||
| Have you used disposable chopsticks/straws/fast food containers in the last two weeks? | |||
| Have you paid more for something because it’s environmentally friendly in the last two weeks? | |||
| Have you bought organic fruit or vegetables in the last two weeks? | |||
| Have you used plastic bags for your shopping in the last 2 weeks? | |||
| Have you picked up litter and put it in the bin in the last two weeks? |
Now use the squared paper (or an online system, if you like!) to represent these findings in a chart or graph.What does that information show us? How can you use that information?
Optional:
- Create more than one graph/chart.
- Show your data in a double bar graph
- Write a summary of what the data shows.